Poverty is humiliating. It correlates with inequality, discrimination, and poor socio-economic position.
Africa is considered the poorest continent in the world, particularly sub-Saharan Africa, home to the world’s poorest countries, with more impoverished people than anywhere else. It’s a place where almost every second person lives below the international poverty line.
Uganda is a low-income sub-Saharan country. It’s among the poorest in the world. Over 41.7% of the population lived in extreme poverty as of 2019/2020 data. In Uganda, absolute poverty is described as a “condition of extreme deprivation of human needs, characterized by the inability of individuals or households to meet or access the minimum requirements for decent human wellbeing, such as nutrition, health, literacy and shelter.”
However, the measures applied to calculate these poverty levels are much lower than the World Bank’s international standards. Uganda’s estimated data is based on US$0.88 – US$1.04, with about 41% of people living on about $1 per day.
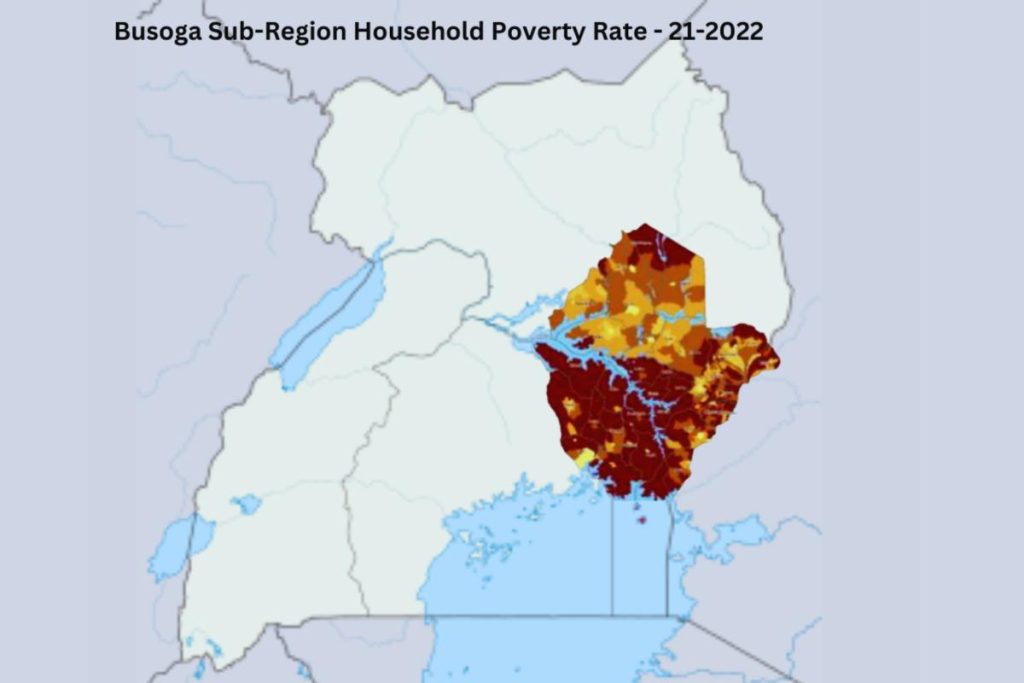

But due to increasing regional inequalities in Uganda that have increased at a higher rate since the 1990s, one region has been confirmed over the years to be the poorest of the poor. That is the Busoga region.
Busoga region is located in the deeper end of the heart of Sub-Saharan Africa, in the Eastern part of Uganda. According to the latest 2019/2020 report released by the Uganda Bureau of Statistics (UBOS) at the Statistics House, on Wednesday, June 2, 2021, the Busoga sub-region was once again ranked the poorest region in Uganda.

Being regarded as the poorest of the poor in a poverty-stricken area of sub-Saharan Africa is incredibly humbling.
While extreme poverty at a national level has generally decreased, this decline has been far from even across regions in the country.
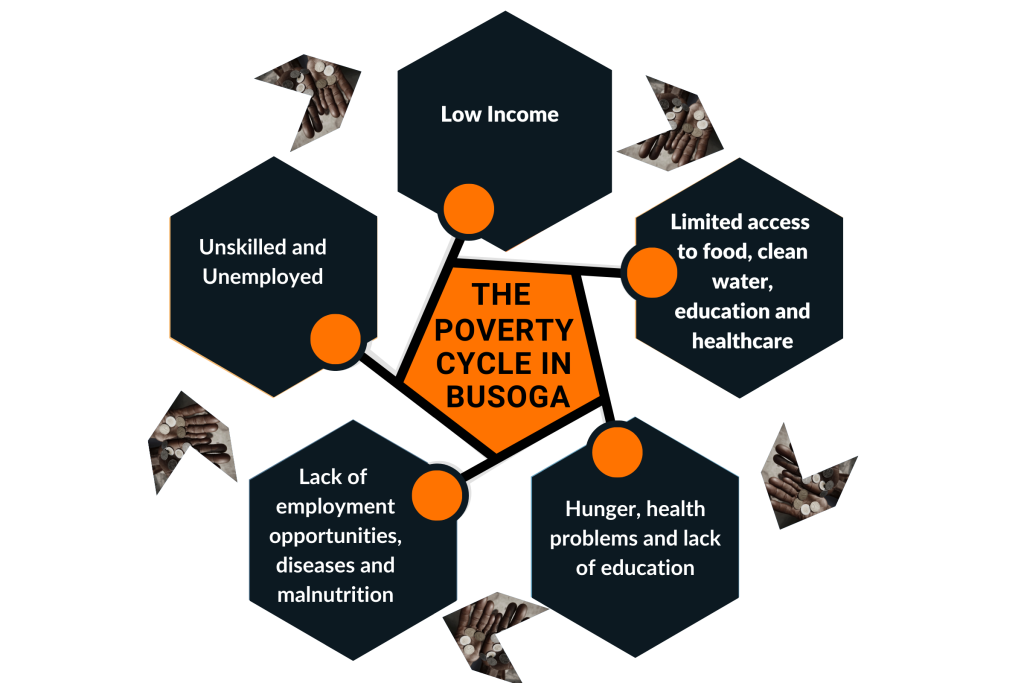
The indication in some reports about the falling poverty at the national level masks the poor regional trends. It doesn’t consider the depth of poverty in the Busoga region. Poverty in Busoga is deep and broad. The conditions of the people experiencing poverty are indeed alarming.

These disparities are noticeable in all sectors of life, even in a non-economic representation of poverty, such as sector performance in education, health, and WASH (Water, Sanitation, and Hygiene).
Poverty remains higher in rural areas than in urban areas. Considering that rural areas comprise about 80% of the population in Busoga, they contribute a higher percentage to the region’s poverty.
The primary sector of agriculture, forestry, and fishing is reported to be poorer than those of production and services. Yet, these are the major sectors where most people in Basoga are employed.
The government’s Poverty Eradication Action Plan (PEAP), which set out strategies to prioritize public expenditure on critical programs geared toward reducing poverty, concentrated its resources mainly in the Central and Western regions of the country. That’s where rapid poverty reduction was experienced.
It’s no wonder that poverty headcounts keep increasing in the Busoga region more than anywhere else in the country. All the mapping of the most recent extreme poverty data by the UBOS indicates that the living conditions in Busoga are, indeed, alarming.
After the Busoga region overtook the Northern part as the poorest, its poverty levels steadily increased, from 24.3% in 1999/2000 to 35.7% in 2016/17.
The report of the Uganda National Household Survey of 2016-17 stated that the proportion of the population living in poverty significantly increased in absolute terms from 19.7% in 2012/13 to 21.4% in 2016/17 – equivalent to about 10 million people living below the poverty line. And as all reports insist, the increase in poverty was most prominent in the Eastern region – the Busoga region, where the nation’s poverty is concentrated.
Vulnerable to Poverty and the Working Poor
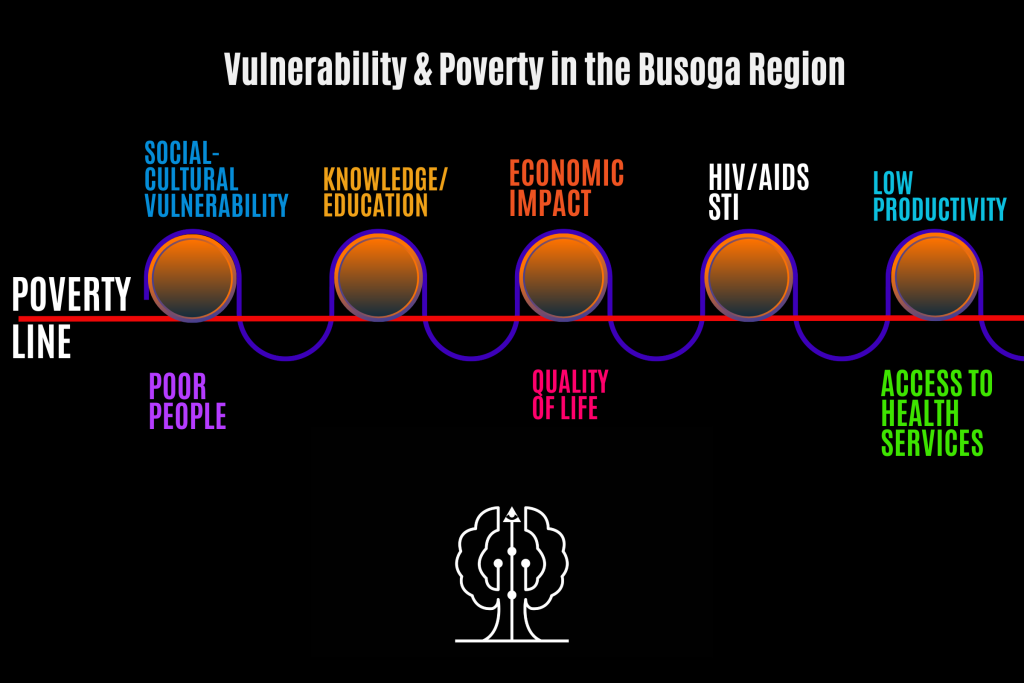
The proportion of those who live above the poverty line falls under and remains “vulnerable to poverty.” These people are simply hovering around the poverty line – surviving on the verge of falling below the line. Whatever measures helped them climb above the poverty line didn’t address or lay strategies for preventing poverty.
Those in the same survival mode are categorised as “the working poor,” whose expenditure (as a proxy for income) falls below the poverty line.
Poverty, the Major Constraint
Eradication of poverty in all its forms has been identified as the number one goal in achieving the Sustainable Development Goals (SDG). In Busoga, poverty eradication is the top constraint to growth and development in all sectors.
It is the major stumbling block to the attainment of the region’s primary objective – to become truly literate as a means of achieving transformation in becoming an ecologically sustainable developed society.
Primarily, the money-metric approach measures welfare. The rationale for the money-metric approach is that an individual or a household above the monetary poverty line is thought to possess the necessary purchasing power to acquire the bundle of attributes considered adequate to generate a sufficient level of well-being.
Uganda National Household Survey (UNHS)
The Uganda National Household Survey (UNHS) uses household expenditure rather than individual income to measure the population’s living standards. This is a preferred approach because respondents’ information on expenditures is more reliable than income data.
Also, households are more likely to reveal their expenses than their incomes. In addition, it has been argued that individual consumption depends on expected earnings over the long term.
Nevertheless, household income is the most crucial determinant of economic well-being. It provides a measure of the resources available to the household for consumption and saving.
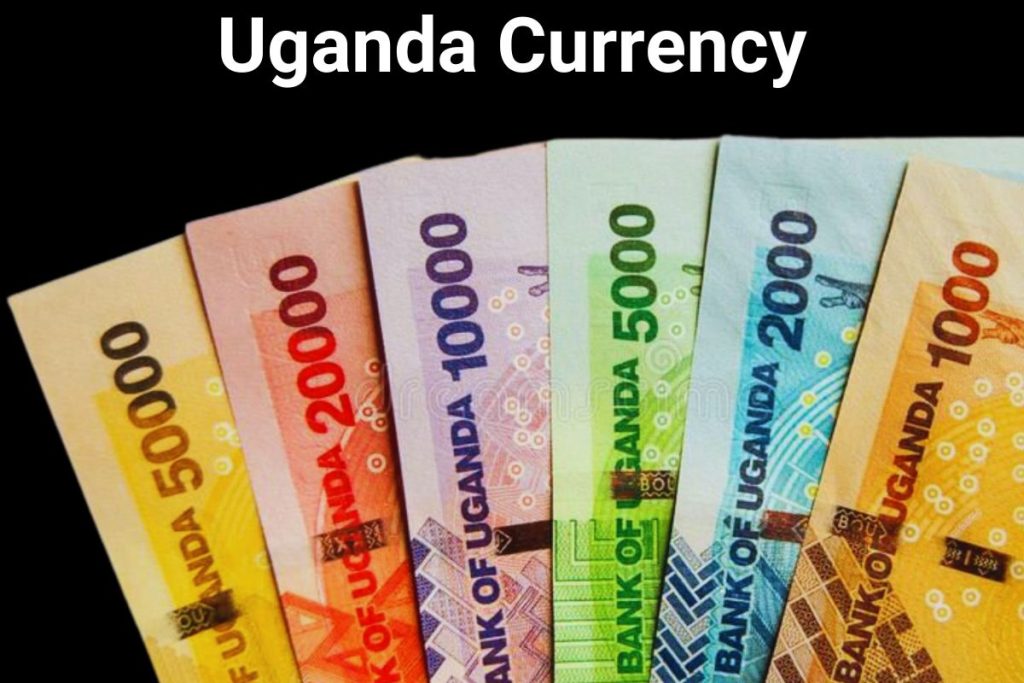
Most households receive their income in cash (56%), followed by in-kind (31%).
The report indicated that Busoga’s average nominal monthly household income increased from UG 194,900 in 2012/13 to 222,000 in 2016/17.
The most recent survey of 2019 showed that Busoga’s average household monthly expenditure dropped as the proportion of people living in poverty significantly increased in absolute terms.
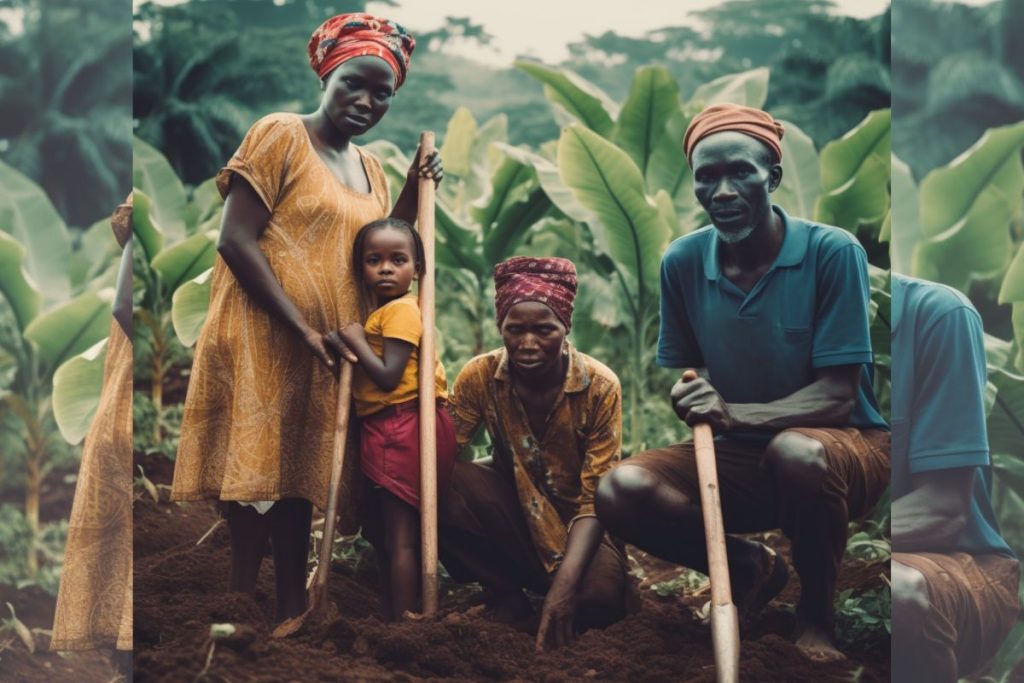
For households whose primary source of income was subsistence farming, more than half (53%) received income in cash. In comparison, 42% received income in kind.
For households whose primary source of income was remittances, nearly half (48%) received it in-kind, while close to two in every ten families (17%) received it through mobile money.
The large proportions of households receiving incomes in-kind highlight the extent of the informality of payments.
Ownership and control of income-generating assets
Ownership and control over assets such as land and housing provide multiple benefits to individuals and households, including a secure place to live, livelihoods, protection during emergencies, and collateral.
The list of respondents’ assets recorded in the survey included agricultural land, occupied houses, furniture, refrigerators, T.V.s, mobile phones, motor vehicles, radios, bicycles, livestock, appliances, cassettes, home theatres, vehicles, and cars, among others.
The household surveys conducted by the Uganda Bureau of Statistics (UBOS) are the key source of Uganda’s poverty data.
Regarding frequency, Uganda has produced three critical sources of poverty data that include household income and expenditure from 2000 to 2020: the 2005/6, 1999/2000, 2012/13, and 2016/17 national household surveys.
There is also data from the demographic and health surveys (DHS) for 2000/01, 2005/06, 2010/11, and 2016/17 carried out every five years.
The 2014 Uganda national population and housing census data has been consulted, as well.
Savings Mechanisms
When household respondents were asked about the various saving mechanisms they used, overall, keeping money at home/a secret place was the most commonly used mechanism (33%), followed by saving with Village Savings and Loans Associations (VSLAs) (16%). Only 8% used commercial banks to save their money.
Typically, the available mechanisms for saving money vary in the region, in both formal and informal institutions.
The formal savings mechanisms include saving with a commercial bank, Microfinance Deposit Institutions (MDIs), Micro Finance Institutions (MFIs), and Savings and Credit Cooperatives (SACCOs).
Informal savings mechanisms include: keeping money at home in a secret place, Village Savings and Loans Associations (VSLAs), Rotating Savings and Credit Associations (ROSCAs), Go Rounds, or mobile money services.
Investments
Household respondents were asked which investment options were available in their localities and whether their households used them at the time of the survey.
The report indicated that the existing personal businesses (88%) and investment in livestock (82%) were households’ most commonly available investment options.
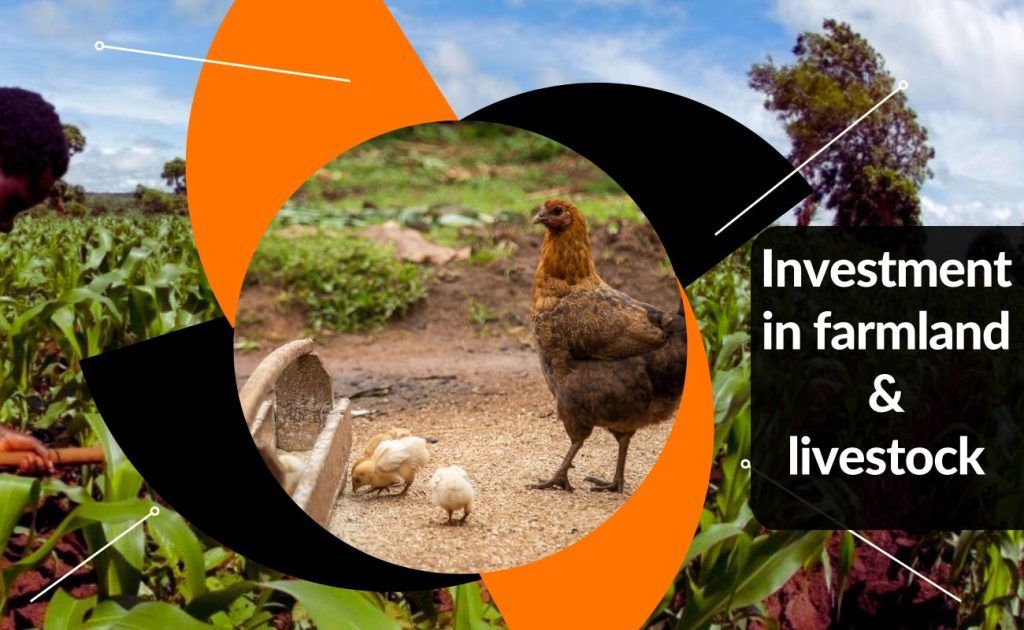
The results showed that investment in farmland was the most commonly used investment option by households (59%), followed by livestock (42%), while fixed Deposit Accounts (1%) were the least used.
Source of Loans
Persons who sought loans/credit were asked about the sources of loan/credit. The results indicated that, overall, informal sources as a source of loans accounted for 79%. Only 21% sought loans/credit from formal sources.
Among the formal sources, commercial banks (9%) and SACCOs (7%) were the major ones. VSLAs were predominant (31%) among the informal sources.
The main reasons why people seek loans/credit are different. Overall, one in every four persons (25%) mainly sought a loan/credit to buy consumption goods and services. Twenty-three per cent borrowed to pay education expenses, while only close to one in every five persons (18%) sought a loan/credit to purchase inputs or working capital for non-farm enterprises. This last reason was mainly for members with relatively normal access to towns or urban centres.
Mobile Money

Access to and use of mobile money refers to electronic financial transactions and services that can be carried out using a mobile device, such as a mobile phone or tablet. These services may or may not be linked directly to a bank account. However, these services have transformed the financial services landscape in the nation and continue to deepen financial inclusion, where the proportion of the ” banked ” population is still relatively low.

Household members aged 16 years or above were asked about knowledge of mobile money, registration for mobile money services, and, for those who still need to register, whether they were using another person’s mobile money account. Seventy-five per cent of the household population was knowledgeable about mobile money, with more males (81%) than females (70%) being familiar.

